
ප්රවණතා සහ තහවුරු කිරීම
RSI 30 සහ 70 කියන්නේ මොනවාද? Momentum සහ divergence කියවන හැටි
RSI ගණනයේ අර්ථය, overbought/oversold ලේබල් වැරදි ලෙස භාවිතා නොකර trend සහ divergence සමඟ සලකා බැලීම.
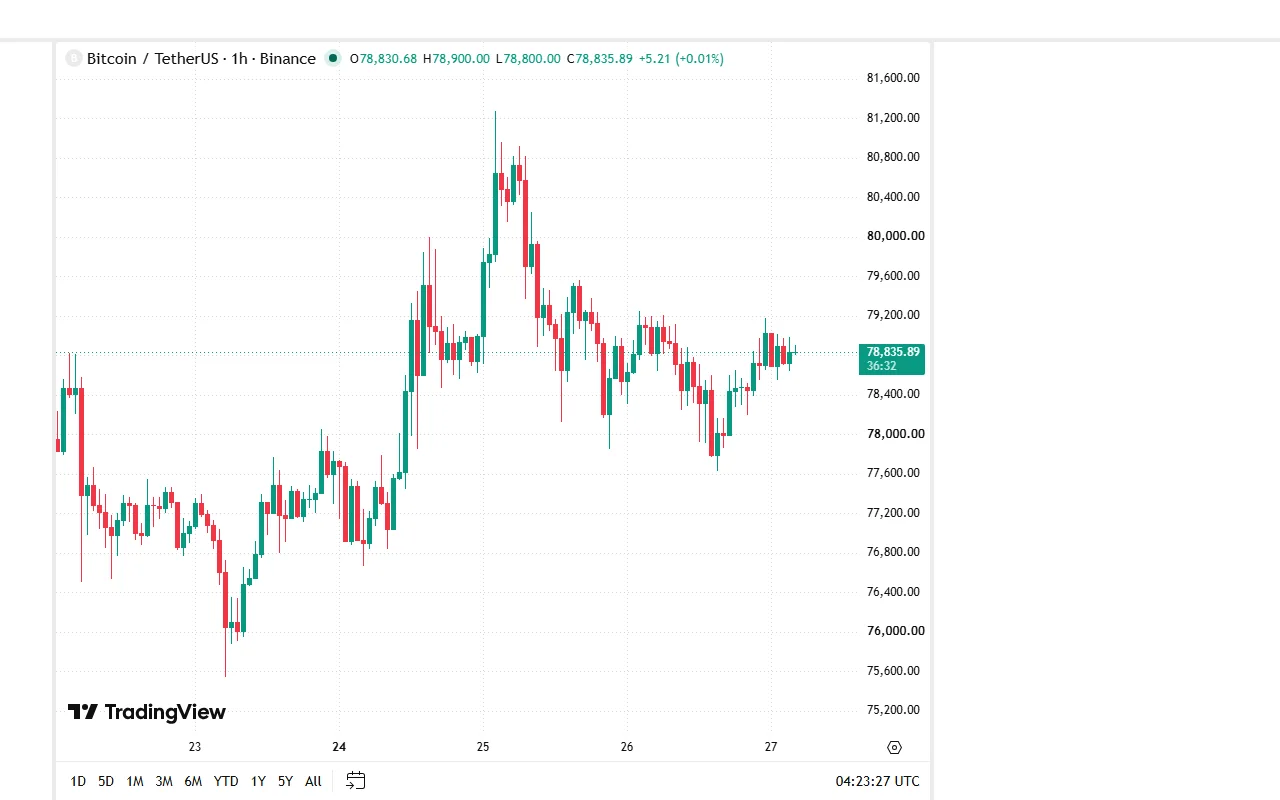
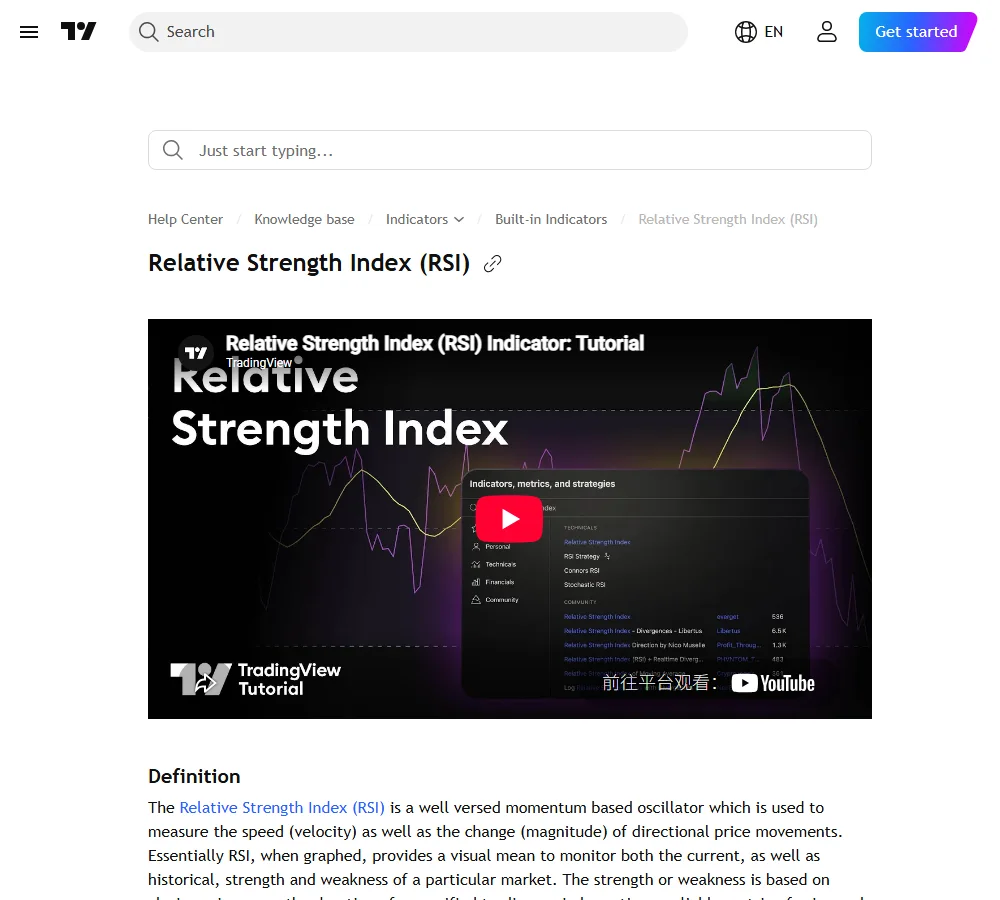
මෙම screenshot එක 2026-08-27T05:42:13Z දී TradingView හි Relative Strength Index (RSI) නිල Help Center පිටුව වෙතින් ලබාගත් සැබෑ webpage capture එකකි. මෙය live BTCUSDT signal screenshot එකක් නොවේ; indicator එකේ නිල definition, calculation සහ settings reference එක පෙන්වන පිටුවකි. පහත workflow එක readerගේම chart එකේ closed bars භාවිතා කර RSI සහ divergence නැවත සාදයි.
Relative Strength Index (RSI) යනු recent price changes වල වේගය සහ ප්රමාණය සාරාංශ කරන momentum oscillator එකකි. එය 0–100 අතර අගයක් පෙන්වයි. සාමාන්ය 14-period setting එකේ 70ට ඉහළ overbought සහ 30ට පහළ oversold ලෙස ලේබල් කරන නමුත් ඒවා ස්වයංක්රීය sell සහ buy බොත්තම් නොවේ.
ශක්තිමත් uptrend එකක RSI දිගටම 70ට ඉහළ රැඳිය හැකි අතර downtrend එකක 30ට පහළ දිගටම සිටිය හැක. එබැවින් RSI අගය එකක් දැක direction එක තීරණය කරනවා වෙනුවට trend, price structure සහ key level එක සමඟ එය කියවන්න.
සැබෑ TradingView chart එකේ RSI test එක සකස් කරන්න
- Supercharts විවෘත කර symbol, venue සහ timeframe එක තහවුරු කරන්න; උදාහරණයක් ලෙස BTCUSDT · Binance · 1H. Spot/futures source දෙක මිශ්ර නොකරන්න.
- Indicators තුළ Relative Strength Index තෝරා length = 14, source = close තබන්න. Test එක සඳහා 30, 50 සහ 70 levels පෙන්වා offset/smoothing වෙනස් නොකළ settings ලියන්න.
- Rightmost live candle එක මඟහැර closed bar එකක close time, close price සහ RSI value එක journal එකට ලියන්න. Timezone එක UTC හෝ ඔබ තෝරාගත් එකක් ලෙස ස්ථාවරව තබන්න.
- RSI 30/70 cross එකක් ලැබුණොත් price trend, key level සහ structure verdict එකත් එකම row එකේ දාන්න. Gauge හෝ indicator label එක buy/sell instruction එකක් ලෙස නොගන්න.
- Settings වෙනස් කළොත් අලුත් test series එකක් ආරම්භ කරන්න. Outcome එක දැකලා length, timeframe හෝ pivot rule එක මාරු නොකරන්න.
Official page screenshot එක indicator එක සොයාගැනීමට reference එකක් පමණි. Actual RSI value සහ divergence evidence readerගේ symbol/timeframe/data feed එකෙන් ලබාගත යුතුය.
RSI ගණනයෙන් මනින දේ
TradingView දක්වන Wilder ගණනයේ මූලික සූත්රය මෙයයි:
RSI = 100 − 100 ÷ (1 + RS)
RS = smoothed average gain ÷ smoothed average loss
Default source එක candle close සහ default length එක bars 14කි. මෙහි “relative strength” යනු asset දෙකක් සසඳන relative-strength ratio එක නොව, එම price series එකේ recent gains හා losses සසඳන අගයකි. උදාහරණයක් ලෙස smoothed average gain 6ක් සහ loss 4ක් නම් RS = 1.5 සහ RSI = 60 වේ. මෙය ගණනය පැහැදිලි කරන සරල උදාහරණයක් පමණි; live signal එකක් නොවේ.
පළමු average එකෙන් පසු Wilder smoothing භාවිතා වන නිසා platform එකේ exact implementation, data feed සහ candle closes එකිනෙකට ගැළපිය යුතුය. Period එක 14 සිට 7ට අඩු කළොත් indicator එක වේගයෙන් ප්රතිචාර දක්වන නමුත් noise ද වැඩි විය හැක. Period එක දිගු කළොත් ප්රතිචාරය සෙමින් වේ. Backtest එකක නීතියක් නොමැතිව settings වෙනස් කර හොඳ පෙනෙන signal පසුපස යන්න එපා.
Closed daily data එකෙන් Wilder RSI14 සම්පූර්ණ කරන්න
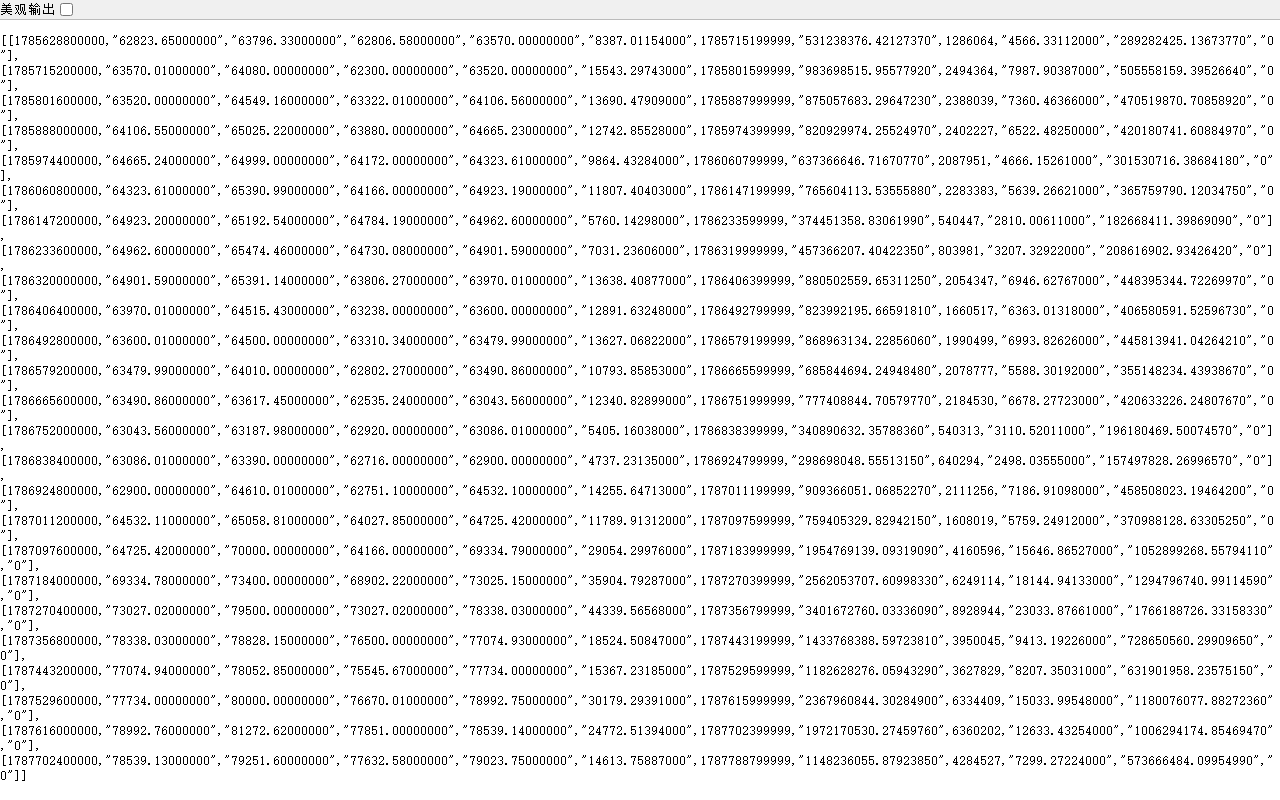
එකම Binance නිල BTCUSDT 1D closed dataset එකේ අවසාන closes 16, Aug 11–26, මෙසේය: 63,600.00 | 63,479.99 | 63,490.86 | 63,043.56 | 63,086.01 | 62,900.00 | 64,532.10 | 64,725.42 | 69,334.79 | 73,025.15 | 78,338.03 | 77,074.93 | 77,734.00 | 78,992.75 | 78,539.14 | 79,023.75.
Aug 12–25 changes 14 සඳහා positive changes එකතුව 17,409.17, absolute negative changes එකතුව 2,470.03. එබැවින්:
- Initial average gain = 17,409.17 ÷ 14 = 1,243.5121429.
- Initial average loss = 2,470.03 ÷ 14 = 176.4307143.
- RS = 1,243.5121429 ÷ 176.4307143 = 7.0481614.
- 2026-08-25 RSI14 = 100 − 100 ÷ (1 + 7.0481614) = 87.5748.
- Aug 26 change = 79,023.75 − 78,539.14 = +484.61. Wilder update: average gain = (1,243.5121429 × 13 + 484.61) ÷ 14 = 1,189.3048469; average loss = (176.4307143 × 13 + 0) ÷ 14 = 163.8285204.
- 2026-08-26 RSI14 = 87.8927, එබැවින් state = above 70.
මෙහි RSI Aug 25 සහ Aug 26 දෙදිනම 70ට ඉහළ තිබියදී price close 78,539.14 සිට 79,023.75ට ඉහළ ගියේය. එබැවින් “RSI > 70 = දැන් sell” rule එක මෙම සැබෑ sample එකෙන්ම FAIL වේ. State එක overbought label එකක් පමණි; price confirmation නොමැති නිසා trade verdict = NO SIGNAL.
Fixed 96-bar window එකෙන් divergence candidate එක පරීක්ෂා කරන්න
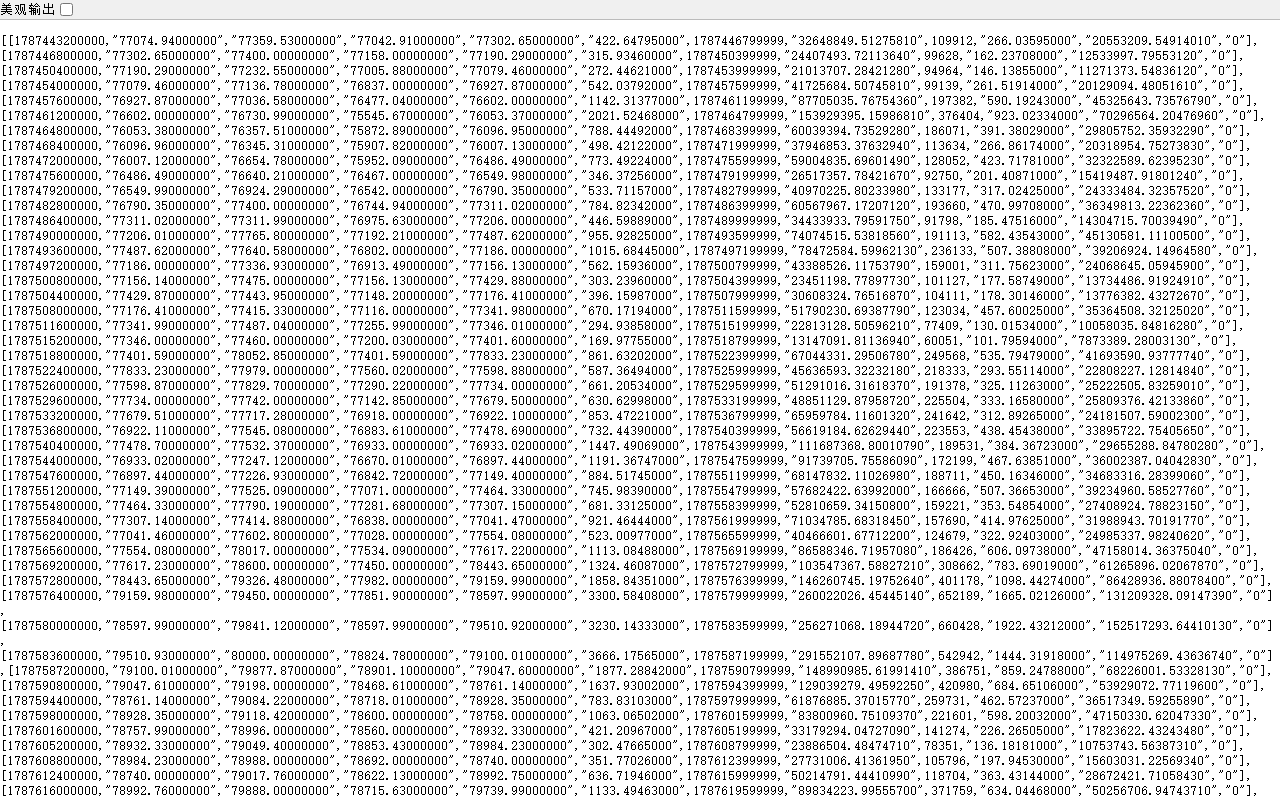
මෙම 2026-08-23T00:00:00+00:00 සිට closed 1H bars 96 fixed window එකේ පළමු changes 14කින් Wilder seed එක සාදා ඉදිරියට recursive update කරන්න. Two-left/two-right price-pivot rule එක කලින් freeze කරමු; RSI turns වෙනම තෝරා නොගන්න.
- P1 — 2026-08-25T13:00:00+00:00: low 78,120.74, RSI14 43.7889. වම් lows 79,044.18 සහ 78,640.00; දකුණු lows 78,531.55 සහ 79,020.04 — හතරම candidate low එකට ඉහළ නිසා pivot low PASS. දෙවන right bar close වූ 2026-08-25T15:59:59.999+00:00දී pivot එක confirmed වේ.
- P2 — 2026-08-25T21:00:00+00:00: low 77,851.00, RSI14 44.2061. වම් lows 78,728.35 සහ 78,165.27; දකුණු lows 78,569.99 සහ 78,396.88 — හතරම candidate low එකට ඉහළ නිසා pivot low PASS. දෙවන right bar close වූ 2026-08-25T23:59:59.999+00:00දී pivot එක confirmed වේ.
- Price₂ 77,851.00 < Price₁ 78,120.74 සහ RSI₂ 44.2061 > RSI₁ 43.7889 — bullish divergence candidate PASS.
- Pivots අතර swing high 79,563.71. P2 confirm කිරීමට අවශ්ය Aug 25 22:00 සහ 23:00 right bars entry-confirmation bars ලෙස ගණන් නොගන්න. P2 confirmation පසු ඉදිරි closed bars හතර ඇතුළත 79,563.71ට ඉහළ close වීම price-confirmation rule එක ලෙස freeze කළ විට Aug 26 00:00–03:00 closes 78,631.79, 78,815.13, 79,108.00 සහ 79,088.62 සියල්ල එයට පහළය. එබැවින් price confirmation FAIL / no trade.
- Candidate invalidation level එක P2 low 77,851.00. Confirmationට පෙර එයට පහළ closed low/close එකක් ලැබුණොත් candidate එක අහෝසි කරන්න.
RSI initialization history මත early values සුළු වශයෙන් වෙනස් විය හැක. ඉහත RSI values මෙම exact 96-bar, first-14-change seed සහ Binance Spot BTCUSDT feed එකට පමණක් අදාළ reproducible worksheet values වේ; වෙනත් platform value එකක් සමඟ සසඳන විට feed, source, session, seed සහ history window එකම කරන්න.
30 සහ 70 නිවැරදිව කියවන්න
70ට ඉහළ අගයක් recent gains recent losses ට වඩා ශක්තිමත් බව පෙන්වයි; එය “මිල දැන් අනිවාර්යයෙන් වැටේ” කියන කාල නියමයක් නොවේ. 30ට පහළ අගයත් එසේම reversal එකක් සහතික නොකරයි. මුලින් higher-timeframe direction එක සහ price එක support/resistance zone එකකද බලන්න.
Practical checklist එකක්:
- Candle එක close වී RSI අගය ස්ථිර වී තිබේද?
- Price එක trend එකකද range එකකද?
- RSI extreme එක key price level එකක් අසලද?
- Price structure එකෙන් reversal හෝ continuation confirmation තිබේද?
- අදහස වැරදි බව පිළිගන්න invalidation level එක කලින් තිබේද?
මෙම ප්රශ්නවලට පිළිතුරු නැත්නම් 30/70 signal එකක් පමණක් මත trade idea එකක් ගොඩනැගීම දුර්වලයි.
RSI 50 line එකෙන් momentum context එක ගන්න
RSI 50ට ඉහළ තිබීම තෝරාගත් lookback එකේ average gains average losses ට වඩා ඉහළ බවත්, 50ට පහළ තිබීම ප්රතිවිරුද්ධ බවත් පෙන්වයි. එය price trend එකට අතිරේක context එකක් ලෙස භාවිතා කළ හැක. උදාහරණයක් ලෙස price එක HH සහ HL පෙළක් තබාගන්නා අතර pullback පසු RSI නැවත 50 ඉක්මවීම continuation hypothesis එකක් පරීක්ෂා කිරීමට උපකාරී විය හැක. එහෙත් price structure එක බිඳී තිබේ නම් RSI 50 cross එක තනිව ප්රමාණවත් නොවේ.
Timeframe දෙකක් භාවිතා කරනවා නම් ඒවායේ කාර්යය වෙනම ලියන්න: උදාහරණයක් ලෙස 4H chart එක trend context සඳහාත් 1H chart එක setup සඳහාත්. Signal පෙනෙන සෑම අවස්ථාවකම timeframe මාරු කළොත් නීතිය පරීක්ෂා කළ නොහැක.
Divergence එක closed bars වලින් ලකුණු කරන්න
Bearish divergence එකක price higher high එකක් කරන අතර RSI lower high එකක් කරයි. Bullish divergence එකක price lower low එකක් කරන අතර RSI higher low එකක් කරයි. එය නැවත කළ හැකි ලෙස මෙම mechanical rule එක භාවිතා කරන්න:
- Price pivot high සඳහා candidate bar එකට වම් සහ දකුණු closed candles දෙක බැගින් අඩු highs තිබිය යුතුය. Pivot low සඳහා lows ප්රතිවිරුද්ධ වේ.
- දකුණු candles දෙක close වන තුරු pivot එක provisional ලෙස තබන්න. Confirm වූ පසු pivot bar close timestamp, price high/low සහ එම bar එකේම RSI value ලියන්න.
- Confirmed pivot highs දෙකක් සඳහා Price₂ > Price₁ සහ RSI₂ < RSI₁ දෙකම true නම් bearish divergence candidate එකකි.
- Confirmed pivot lows දෙකක් සඳහා Price₂ < Price₁ සහ RSI₂ > RSI₁ දෙකම true නම් bullish divergence candidate එකකි.
- Price pivot bars දෙකට RSI turns එකම bars වලින් ගැළපෙන්නේ නැත්නම් හෝ inequality එකක් fail නම් clean divergence නැත ලෙස සටහන් කරන්න. Result එක ලබාගැනීමට වෙනත් RSI peaks දෙකක් පසුව තෝරා නොගන්න.
- Candidate එක complete වුවත් reversal signal එකක් ලෙස නොගන්න. Price level rejection, candle close, relevant swing break හෝ කලින් ලියූ confirmation එක ලැබෙන තුරු entry verdict එක හිස්ව තබන්න.
- Confirmation ලැබුණු bar, invalidation price, stop distance සහ candles පහකට පසු outcome එක සටහන් කරන්න. Price trend එක divergence තිබියදී දිගටම ගිය failures ඉවත් නොකරන්න.
Journal row එකට pivot-1 time/price/RSI | pivot-2 time/price/RSI | bullish/bearish/none | confirmation | invalidation fields තබන්න. මෙය chart screenshot එකක් පසුව බලලා කැමති peaks සම්බන්ධ කරන hindsight bias අඩු කරයි.
Failure swing එක RSI තුළම කියවන්න
TradingView පැහැදිලි කරන bullish failure swing එකේ RSI මුලින් 30ට පහළ යයි, නැවත 30ට ඉහළ එයි, pullback එක 30ට ඉහළ රඳාපවතියි, පසුව පෙර RSI high එක බිඳයි. Bearish version එකේ එහි ප්රතිවිරුද්ධ පියවර සිදුවේ. මෙය price pattern එකක් නොව RSI line එකේ පියවර හතරකි. ඒත් trade entry එකට price level සහ risk control වෙන්ව අවශ්යය.
Live candle සහ data-feed වැරදි
Live candle එකේ close වෙනස් වන තුරු RSI අගයද වෙනස් වේ; මෙය repainting වංචාවක් නොව incomplete input එක වෙනස් වීමයි. Screenshot හෝ journal එකේ exchange, pair, spot/futures source, timeframe, RSI period සහ candle close time එක සටහන් කරන්න. Platform දෙකක session boundary හෝ historical bars වෙනස් නම් අගයන් සුළු වශයෙන් වෙනස් විය හැක.
RSI journal අභ්යාසය
එකම pair සහ timeframe එකේ RSI 70 ඉක්මවූ අවස්ථා 20ක් සහ 30ට පහළ ගිය අවස්ථා 20ක් තෝරන්න. එක් එක් අවස්ථාවට trend structure, key level, RSI value, divergence තිබුණාද, confirmation ලැබුණේ කුමන close එකේද සහ candles පහකට පසු outcome එක ලියන්න. Reversal නොවී trend දිගටම ගිය samples ඉවත් නොකරන්න. අවසානයේ RSI extreme එක තනිව භාවිතා කළ ප්රතිඵලය සහ price confirmation එකක් අවශ්ය කළ ප්රතිඵලය වෙන වෙනම ගණන් කරන්න.
මූලාශ්ර: TradingView — Relative Strength Index, Binance Academy — RSI Indicator. ඉහළ රූපය TradingView නිල RSI Help Center පිටුවේ සැබෑ webpage capture එකකි. අතීත momentum අනාගත ප්රතිඵල සහතික නොකරයි.