
කැන්ඩල්ස්ටික් රටා
Doji candlestick meaning: pattern එක සිංහලෙන් කියවන හැටි
Open සහ Close සමාන වන Doji candle එක හඳුනාගැනීම, trend සහ key level සමඟ තහවුරු කිරීම, සහ වැරදි සංඥා වළක්වාගැනීම.
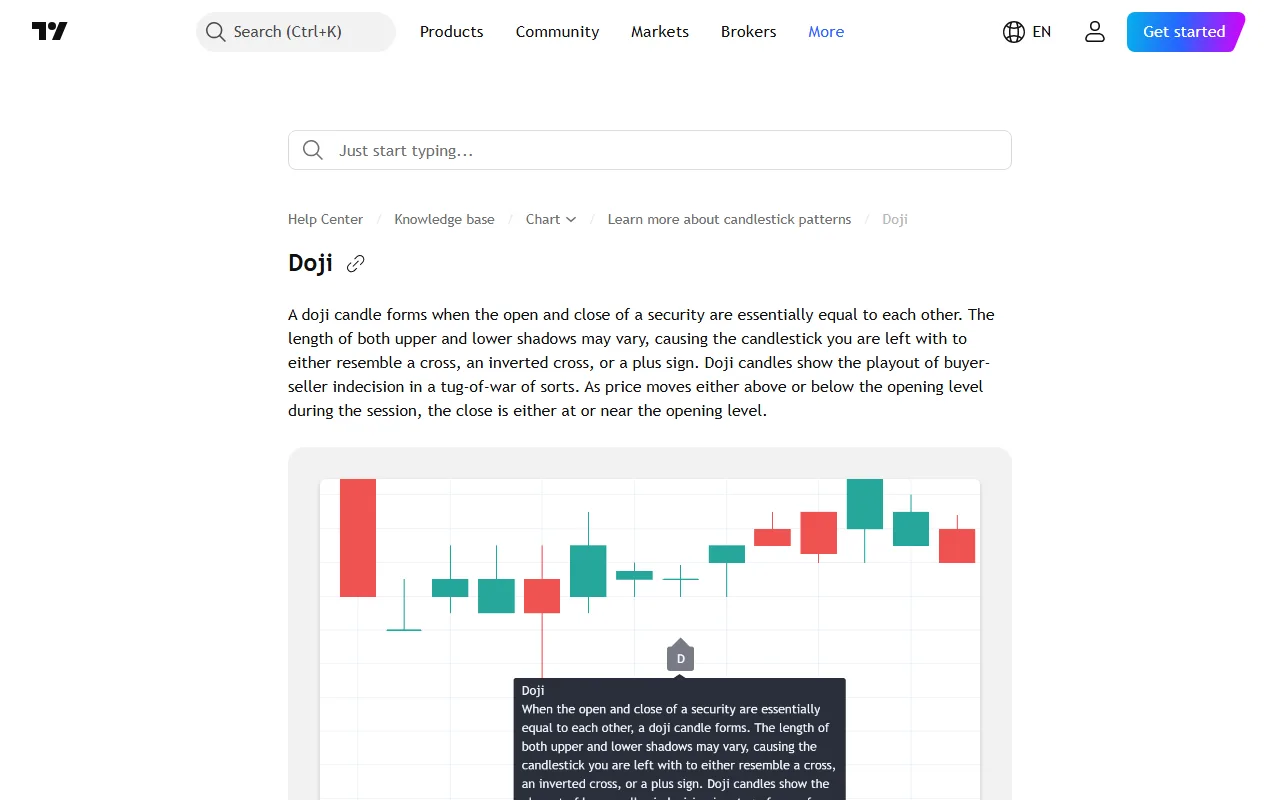
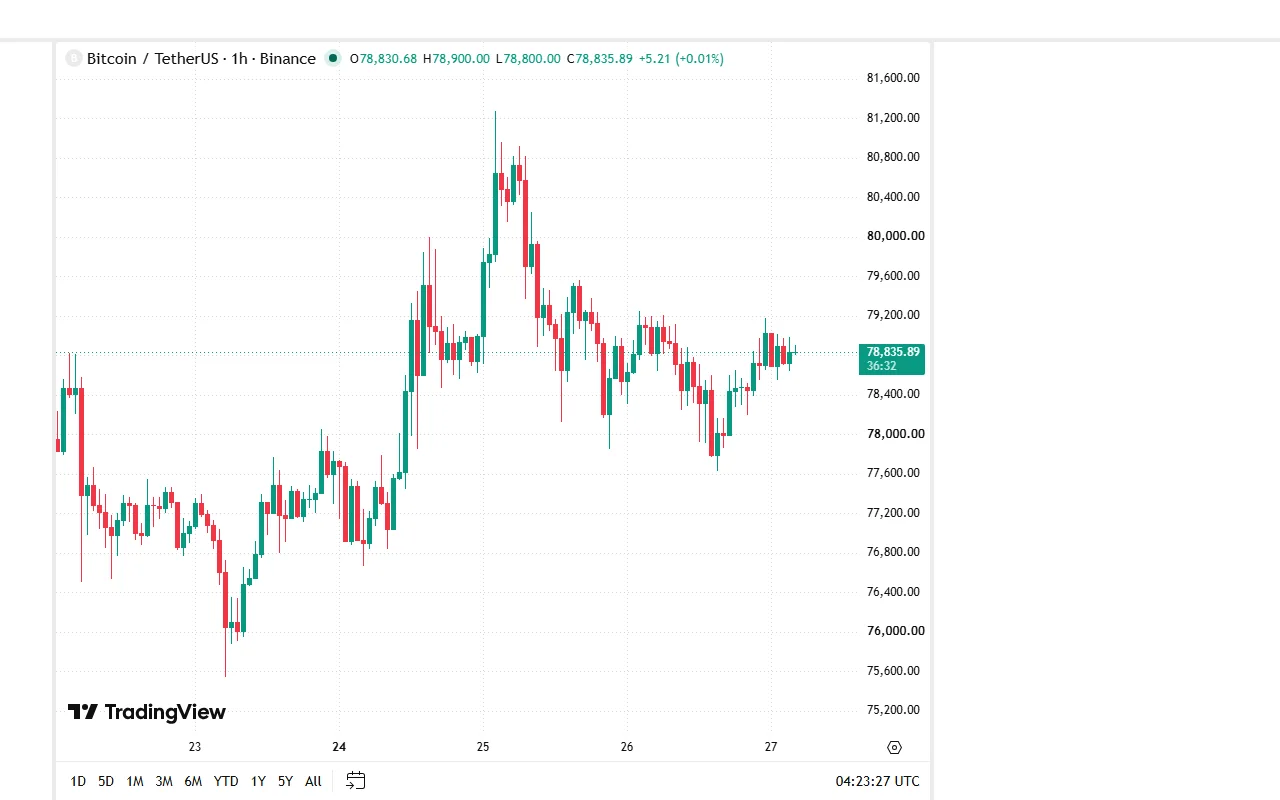
මෙම screenshot එක 2026-08-27T04:23:27Z දී TradingView හි BINANCE:BTCUSDT 1H public chart එකෙන් ලබාගත් සැබෑ webpage capture එකකි. Header OHLC values අනුව rightmost candle එක 10% research rule එක යටතේ Doji candidate එකක් වුවත්, countdown එක ඉතිරි බැවින් එය තවම confirmed closed Doji එකක් නොවේ.
Doji candle එකක open සහ close මිල එකිනෙකට සමාන හෝ ඉතා සමීපය. Candle එක සෑදෙන කාලය තුළ price ඉහළටත් පහළටත් ගියත් අවසානයේ open අසල close වූ බව එය පෙන්වයි. එයින් buyer සහ seller දෙපාර්ශ්වයටම පැහැදිලි අවසාන පාලනයක් නොලැබුණු බව අර්ථ දැක්විය හැකි නමුත්, ඊළඟ price direction එක Doji එකෙන් පමණක් දැනගන්න බැහැ.
TradingView Doji එක neutral single-candle pattern එකක් ලෙස දක්වන අතර එය trend එකේ ඕනෑම තැනක පෙනිය හැකි බව සඳහන් කරයි. ඒ නිසා shape එක හඳුනාගැනීම පළමු පියවර පමණි; location, පෙර price movement සහ පසු confirmation එක එහි අර්ථය තීරණය කරයි.
Doji එකක් ගණනය කර හඳුනාගන්න
සැබෑ market data වල open සහ close සම්පූර්ණයෙන්ම සමාන වීම අනිවාර්ය නැත. Pair එකේ tick size සහ candle range එක අනුව සුළු වෙනසක් තිබිය හැක. Consistent research rule එකක් සඳහා:
Body size = |Close − Open|
Candle range = High − Low
Body-to-range ratio = Body size ÷ Candle range × 100
Screenshot capture කරන මොහොතේ:
- Open = 78,830.68
- High = 78,900.00
- Low = 78,800.00
- Snapshot Close = 78,835.89
ගණනය:
- Body = |78,835.89 − 78,830.68| = 5.21.
- Range = 78,900.00 − 78,800.00 = 100.00.
- Body-to-range ratio = 5.21 ÷ 100.00 × 100 = 5.21%.
- Upper wick = 78,900.00 − 78,835.89 = 64.11.
- Lower wick = 78,830.68 − 78,800.00 = 30.68.
10%ට අඩු body-to-range rule එක භාවිතා කළොත් මෙම snapshot එක Doji candidate එකකි. එහෙත් screenshot එකේ right-side countdown එක තවම තිබෙන නිසා Close, body සහ ratio වෙනස් විය හැක. Candle close වූ පසු OHLC නැවත ගෙන ratio එක තවම 10%ට අඩුද බලන්න; එවිට පමණක් sample එක journal එකට “Doji” ලෙස ඇතුළත් කරන්න.
10% universal Doji definition එකක් නොවේ. ඔබ 5%, 10% හෝ tick-based tolerance එකක් තෝරාගත්තොත් එය test එක පුරා නොවෙනස්ව භාවිතා කරන්න. High = Low වී range zero නම් ratio එක ගණනය නොකර sample එක ඉවත් කරන්න; එවැනි bar එකක් illiquid market inactivity හෝ data issue එකක් විය හැක.
Closed Doji එකක් අවසානය දක්වා verify කළ උදාහරණය

මෙය Binance නිල Data API endpoint එකෙන් ලබාගත් සැබෑ webpage screenshot එකකි. Binance kline schema එක අනුව array එකේ පළමු අගය open time වන අතර ඊළඟ අගයන් Open, High, Low සහ Close වේ. මෙම bar එක 2026-08-26T19:00:00+00:00 සිට 2026-08-26T19:59:59.999+00:00 දක්වා සම්පූර්ණයෙන්ම closed ය.
- Open = 78,472.41
- High = 78,572.00
- Low = 78,292.00
- Close = 78,475.49
එවිට:
- Body = |78,475.49 − 78,472.41| = 3.08.
- Range = 78,572.00 − 78,292.00 = 280.00.
- Body-to-range ratio = 3.08 ÷ 280.00 × 100 = 1.10%.
- Upper wick = 78,572.00 − 78,475.49 = 96.51.
- Lower wick = 78,472.41 − 78,292.00 = 180.41.
- Cross-check: 3.08 + 96.51 + 180.41 = 280.00.
10% research rule එක යටතේ මෙය confirmed closed Doji sample එකකි. එම bar එක සහ පසු bars දෙකේ නිල data බලන විට, ඊළඟ 1H bar එක Doji low එකට පහළ ගියත් 78,452.04ට Doji range එක ඇතුළේ close විය; close-only rule එකෙන් එය bearish confirmation නොවේ. දෙවන පසු bar එක 78,724.01ට, Doji high 78,572.00ට ඉහළ close වීමෙන් bullish confirmation ලැබුණි. මෙය පසු ප්රතිඵලය වාර්තා කිරීමක් පමණි; ඒ තනි sample එකෙන් strategy edge එකක් හෝ future return එකක් තහවුරු නොවේ.
Wick අනුව පෙනෙන Doji වර්ග
- Long-legged Doji: upper සහ lower wick දෙකම දිගයි; session එක තුළ විශාල range එකක් තිබුණත් close එක open අසලයි.
- Dragonfly Doji: open සහ close high අසල, lower wick දිගයි; පහළ මිලවලින් rejection එකක් පෙනිය හැක.
- Gravestone Doji: open සහ close low අසල, upper wick දිගයි; ඉහළ මිලවලින් rejection එකක් පෙනිය හැක.
- Four-price Doji: open, high, low සහ close ඉතා සමීපය; liquid market එකකට වඩා inactivity ඇති bar එකක් විය හැක.
මෙම නාම price path එක සාරාංශ කරයි; outcome එක සහතික නොකරයි. Downtrend පසු support අසල Dragonfly shape එකක් සහ range මැද ඒම shape එකක් එකම setup එකක් නොවේ.
Location එක pattern නාමයට වඩා වැදගත්
Range එක මැද නැවත නැවත සෑදෙන Doji candles බොහෝවිට දෙපැත්තටම commitment අඩු noise එකකි. සැලකිල්ල වැඩි කළ හැකි contexts තුනක් තිබේ:
- දිගු uptrend පසු පැරණි resistance හෝ swing high අසල.
- දිගු downtrend පසු support හෝ swing low අසල.
- Breakout එකකට පසු retest zone එකක, price තවමත් level එක රඳවාගෙන සිටින විට.
“දිගු trend” යන්නත් rule එකකින් නිර්වචනය කරන්න. උදාහරණයක් ලෙස higher highs/higher lows පෙළක් හෝ lower highs/lower lows පෙළක් තිබීම භාවිතා කළ හැක. පෙර trend එකක් නැත්නම් reversal යන වචනය යෙදීමට reversal වීමට දෙයක් නැත.
Confirmation එකක් තෝරාගන්න
Doji එක close වූ පසු bullish hypothesis එකක් සඳහා එහි high එකට ඉහළින් ඊළඟ candle close වීම බලා සිටිය හැක. Bearish hypothesis එකක් සඳහා Doji low එකට පහළ close එක භාවිතා කළ හැක. Wick එක පමණක් boundary එක ඉක්මවා නැවත Doji range එක ඇතුළට close වුවහොත් එය confirmation ලෙස ගණන් නොගන්නා rule එකක් තෝරාගත හැක.
Confirmation එකටත් context අවශ්යය. Doji high break එක සෘජුව resistance zone එකක් තුළ වැසෙයි නම් upside space අඩු විය හැක. Doji low break එක major support එකට ඉහළම නවතිනවා නම් bearish move එකට ඉඩ සීමිත විය හැක. Entry එකට පෙර nearest opposing level සහ invalidation distance එක සසඳන්න.
Doji එක continuation pause එකක්ද reversal attempt එකක්ද?
Uptrend එකක කුඩා pullback අතර Doji එකක් ඇතිවී පසුව පෙර high එක බිඳෙන්නේ නම් එය continuation pause එකක් විය හැක. එම Doji එක resistance අසල ඇතිවී low එක බිඳී market structure දුර්වල වුවහොත් reversal hypothesis එකක් පරීක්ෂා කළ හැක. Shape එක දෙකේම සමාන නිසා outcome label එක candle එක සෑදෙන මොහොතේ නොව පසු price action එකෙන් තීරණය වේ.
මෙය Doji එක දුටු වහා trade direction එක තෝරා නොගැනීමට හේතුවයි. Scenario දෙකම කලින් ලියන්න: high එකට ඉහළ close වුවහොත් කුමක්ද, low එකට පහළ close වුවහොත් කුමක්ද, දෙකම නොවුණොත් setup එක කල් ඉකුත් වන්නේ කවදාද?
Scanner දෙකක් වෙනස් Doji පෙන්වන්නේ ඇයි?
Scanner එකක් exact open=close condition භාවිතා කළ හැකි අතර තවත් එකක් body/range tolerance එකක් යොදයි. Data feed, exchange, spot හෝ futures market, timezone සහ incomplete candle එකත් result වෙනස් කරයි. TradingView හි chart color setting එක previous close මත සකස් කළ හැකි බැවින් candle වර්ණය open/close relationship එක නියෝජනය නොකරන අවස්ථාද ඇත. Doji සඳහා වර්ණය වැදගත් rule එකක් නොකරන්න.
Crypto market එක 24/7 ක්රියාත්මක වන නිසා daily candle boundary එක platform timezone එකෙන් වෙනස් විය හැක. එකම BTC pair එක UTC daily chart එකක Doji ලෙස පෙනී වෙනත් session boundary එකක නොපෙනීමට මෙය හේතුවක් විය හැක. Journal එකේ exchange, market type, timeframe සහ timezone ලියන්න.
Doji setup එක මඟ හැරිය යුතු අවස්ථා
- පෙර trend එකක් හෝ key level එකක් නොමැති range මැද candle එකක් නම්.
- Pair එකේ liquidity අඩු නිසා spread සහ isolated trades wick shape එක නිර්මාණය කරන්නේ නම්.
- Candle එක තවම close වී නැතිනම්; close වෙනස් වූ විට Doji shape එක අතුරුදහන් විය හැක.
- Confirmation candle එක අසාමාන්ය ලෙස විශාල වී stop distance එක risk plan එකට නොගැළපෙන්නේ නම්.
- Doji high සහ low දෙකම ඉක්මනින් sweep වී direction එකක් රඳවා නොගන්නේ නම්.
Trade එක අතහැරීම pattern analysis එක අසාර්ථක වූ බවක් නොවේ. Clear invalidation එකක් හෝ ප්රමාණවත් reward-to-risk space එකක් නැත්නම් “no setup” යන්න වලංගු conclusion එකකි.
Doji journal අභ්යාසය
එකම liquid pair සහ timeframe එකෙන් Doji samples 30ක් body-to-range rule එකකින් සොයන්න. එක් sample එකකට Doji type, පෙර structure, key level, range, volume, next-candle close සහ candles පහකට පසු location එක ලියන්න. Range මැද samples සහ trend අවසානයේ key level එකක samples වෙනම කාණ්ඩ කරන්න.
Chart එක ඉදිරියට ගෙන යාමට පෙර bullish, bearish හෝ no-trade expectation එක ලියන්න. පසුව outcome එක බැලීමෙන් hindsight bias අඩු වේ. Samples 30 අවසානයේ shape එක පමණක් සහ context-plus-confirmation rule එක සසඳන්න; හොඳ උදාහරණ පමණක් ඉතිරි නොකරන්න.
මූලාශ්ර: TradingView — Doji, TradingView — Candlestick charts සහ patterns හැඳින්වීම, Binance Academy — Candlestick Patterns. පළමු රූපය TradingView public chart එකේ සැබෑ webpage capture එකකි; closed-kline රූපය Binance නිල Data API response එකේ සැබෑ webpage capture එකකි. Pattern එකක් අනාගත මිල හෝ ලාභය සහතික නොකරයි.